Research Blog
How to Test Peptide Purity: HPLC Methods and Standards
Published
Learn how to test peptide purity using HPLC methods. Discover standards, essential workflows, and achieve reliable results for your research.

How to Test Peptide Purity: HPLC Methods and Standards
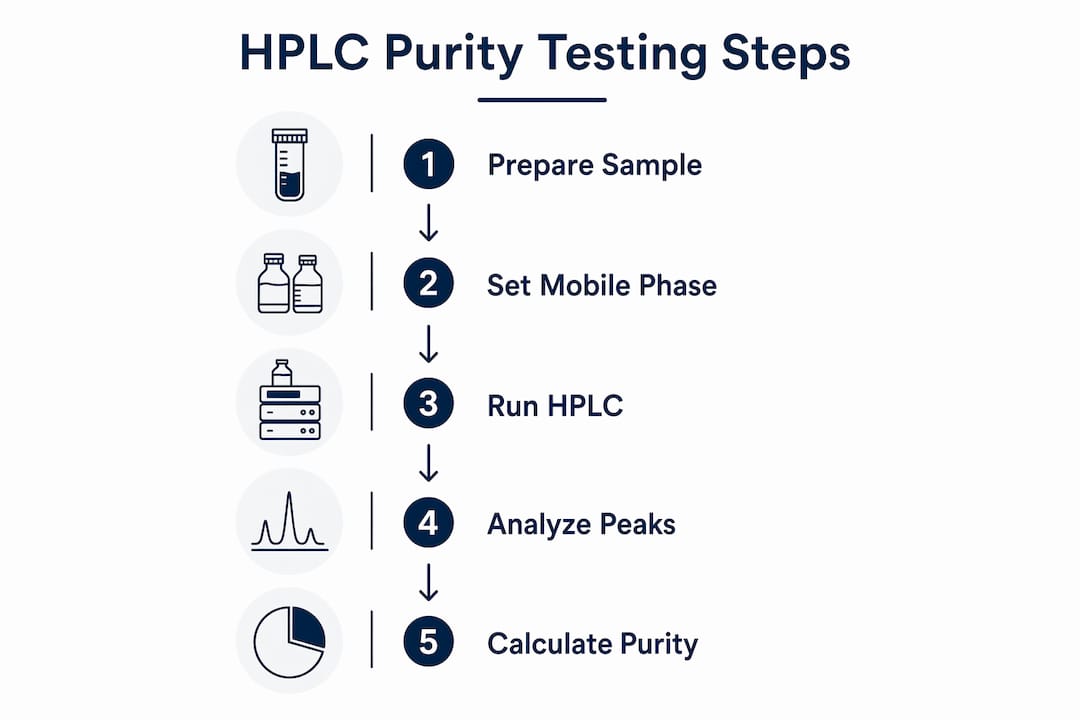
High-Performance Liquid Chromatography (HPLC) is the established standard for peptide purity analysis in research settings. It works by separating the target peptide from impurities on a chromatographic column, then calculating purity as the area percentage of the main peptide peak relative to the total integrated chromatogram area, detected at 214 nm UV. Research-grade peptides vary in purity, generally ranging from 70% up to over 98% as measured by HPLC, with ≥95% purity considered standard for in vivo and sensitive pharmacological studies. Mass Spectrometry (MS) complements HPLC by confirming peptide identity and detecting impurities that co-elute under UV detection alone.
Before running any sample, the core workflow involves:
- Dissolving the peptide in an appropriate solvent (typically water, acetonitrile, or a mixture) at a concentration of 0.1–1 mg/mL
- Injecting 5–20 µL onto a reversed-phase C18 column
- Running a gradient mobile phase program to separate the peptide from impurities
- Detecting absorbance at 214 nm, where peptide bonds absorb uniformly regardless of side chain composition
- Integrating all peaks and calculating the main peak’s area as a percentage of total area
- Confirming molecular weight by ESI-MS or MALDI-TOF to verify identity alongside the chromatographic result
Table of Contents
- How to run an HPLC protocol for peptide purity testing
- What purity thresholds should you use for different research applications?
- What else affects peptide quality beyond chromatographic purity?
- How to interpret a Certificate of Analysis and verify purity claims
- Key Takeaways
How to run an HPLC protocol for peptide purity testing
The column is the most consequential hardware decision in any peptide purity assessment. A reversed-phase C18 column with particle sizes and pore sizes suitable for most synthetic peptides is used. Larger pores improve access and peak shape for longer sequences, while smaller pores work well for short peptides. Analytical scale columns of commonly used dimensions are standard in U.S. laboratory settings.
Mobile phase composition directly affects both resolution and downstream MS compatibility. The most common system uses water and acetonitrile, each containing 0.1% trifluoroacetic acid (TFA). TFA sharpens peaks by suppressing silanol interactions, but it suppresses ionization in electrospray MS. When coupling HPLC to a mass detector, formic acid is the preferred alternative additive, typically at 0.1%, to preserve ionization efficiency without sacrificing resolution.
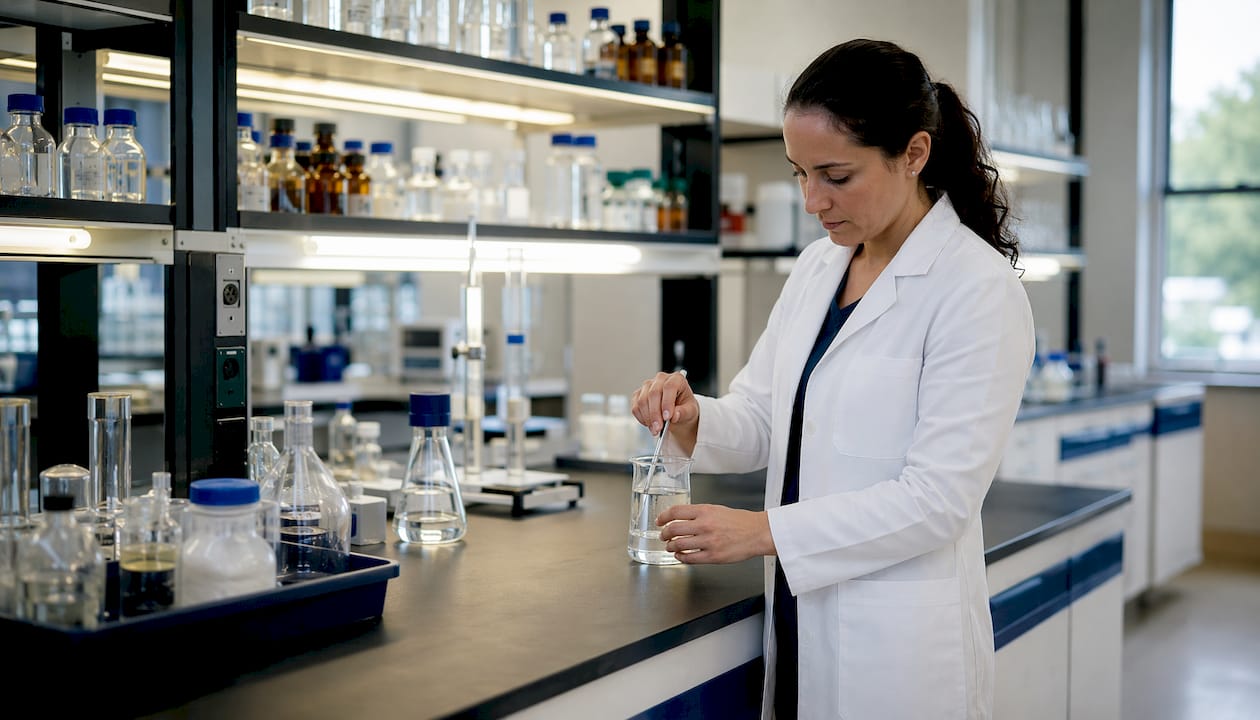
Gradient design determines how well closely related impurities resolve from the main peak. A typical gradient spans 5–60% acetonitrile over 20–60 minutes, with slower rates of 0.1–0.2% acetonitrile per minute improving separation of deletion sequences and oxidized variants. Starting at low organic content (5%) allows hydrophilic impurities to elute early, while the extended ramp resolves hydrophobic species near the main peak.
Detection at 214 nm captures absorbance from the peptide bond backbone, making it applicable to all peptides regardless of aromatic side chain content. Detection at 220 nm is an acceptable alternative when baseline noise at 214 nm is problematic. Key acquisition parameters include:
- Flow rate: 1.0 mL/min for 4.6 mm ID columns; reduce proportionally for narrower columns
- Column temperature: 30–40°C to improve reproducibility and reduce peak tailing
- Injection volume: 5–20 µL; keep consistent across samples and standards
- Run time: extend 5–10 minutes beyond the last expected peak to capture late-eluting impurities
- Integration threshold: set conservatively to capture all peaks above baseline noise, not just the dominant peak
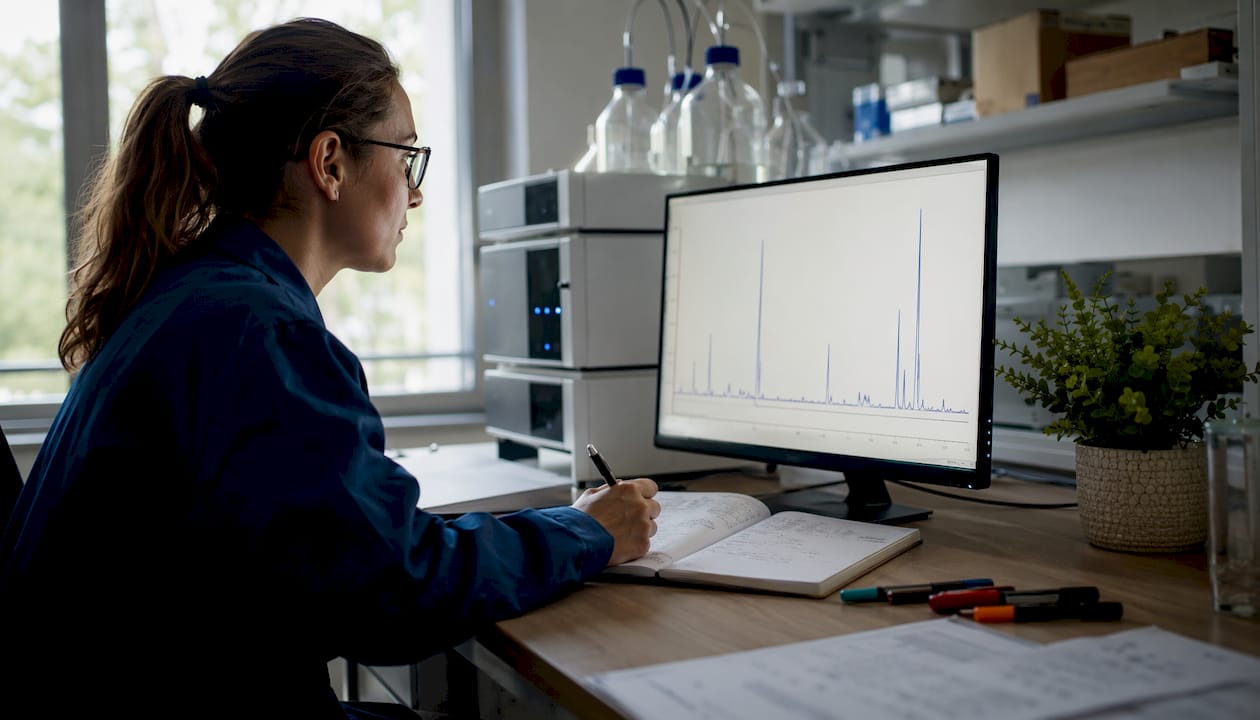
Purity is calculated as the main peak area divided by total peak area, expressed as a percentage. The accuracy of this figure depends entirely on capturing every peak in the chromatogram. Missing late-eluting or early-eluting impurities inflates the reported purity.
Pro Tip: Run a blank injection (mobile phase only) before each sample sequence to confirm baseline cleanliness. A contaminated baseline will artificially inflate or deflate peak areas, skewing purity calculations.
What purity thresholds should you use for different research applications?
Purity requirements are not uniform across research contexts, and applying the wrong threshold introduces real risk to experimental outcomes. The table below summarizes accepted standards by application type.
| Application | Minimum Purity | Rationale |
|---|---|---|
| In vivo pharmacological studies | ≥95% | Reduces off-target biological effects and dose miscalculation risk |
| Receptor binding and cell-based assays | ≥95% | Impurities can activate or block receptors independently |
| Enzyme kinetics and preliminary assays | — | Lower sensitivity to trace impurities in biochemical screens |
| Structural studies (NMR, X-ray) | ≥98% | Heterogeneous samples produce uninterpretable spectra |
| Antibody production and immunization | — | Moderate purity acceptable; adjuvant effects dominate |
| Quantitative proteomics standards | ≥98% | Accurate quantification requires near-homogeneous reference material |
Peptides of higher purity are preferred for in vivo studies, while moderate purity peptides may suffice for enzymatic assays. Using lower-purity peptides in receptor binding studies introduces variability as some portion of the injected mass is unknown material that could affect results. For dose-response experiments, this uncertainty compounds across concentration points, making EC50 or IC50 values unreliable.
Understanding purity levels for precise dosing is especially relevant when working with peptides in neuroscience or metabolic research, where even minor impurities can alter signaling outcomes. A 95% pure peptide at 1 mg/mL contains approximately 50 µg/mL of uncharacterized material. In sensitive assays, that is not a negligible background.
What else affects peptide quality beyond chromatographic purity?
Chromatographic purity is a ratio, not an absolute mass measurement. A peptide reported at 98% HPLC purity may contain substantial water, counter ions, and inorganic residues that do not appear as peaks in the chromatogram. Absolute peptide content is typically lower than chromatographic purity because these non-chromatographable components are invisible to UV detection. Amino acid analysis or elemental analysis is required to determine true mass-based content.
Common impurity classes
- Deletion sequences: incomplete synthesis products missing one or more residues; often co-elute near the main peak
- Oxidized variants: methionine, cysteine, and tryptophan residues are susceptible; appear as +16 Da or +32 Da adducts in MS
- Residual solvents: acetonitrile, DMF, and NMP from synthesis; typically removed by lyophilization but detectable by headspace GC
- Counter ions: TFA from HPLC mobile phases or acetate from ion-exchange steps; TFA content requires 19F-NMR or HPLC with evaporative light scattering detection for accurate quantification
- Truncated sequences and capping products: arise from incomplete deprotection or premature chain termination
The role of Mass Spectrometry
MS confirms peptide identity by comparing observed monoisotopic mass to the theoretical value calculated from the amino acid sequence. ESI-MS is the dominant method for peptides under 10 kDa due to soft ionization and direct compatibility with LC systems. MALDI-TOF is useful for larger peptides and mixtures but provides less quantitative impurity data.
Combining optical detection with mass detection increases confidence in purity measurements by distinguishing co-eluting impurities that share UV absorbance but differ in mass. A peptide that appears as a single UV peak may contain two species of similar hydrophobicity. MS resolves this ambiguity directly. High HPLC purity alone does not confirm correct sequence; MS-based molecular weight verification is required before drawing conclusions about peptide quality.
Calibration, validation, and troubleshooting
HPLC systems used for peptide purity testing should be calibrated with certified reference standards before each analytical sequence. System suitability tests typically include column efficiency (theoretical plates), peak symmetry (tailing factor ≤ 2.0), and retention time reproducibility (RSD ≤ 1%). Detector linearity should be confirmed across the expected concentration range.
When chromatograms produce inconsistent results, the most common causes are:
- Peak tailing: silanol interactions with basic residues; remedy by adding TFA or switching to a newer end-capped column
- Shifting retention times: column degradation or temperature fluctuation; replace column or recalibrate oven
- Ghost peaks: carryover from previous injection; extend wash cycle or increase flush volume
- Broad or split peaks: sample solubility mismatch with initial mobile phase; dissolve in weak solvent matching the starting gradient composition
- Low signal: peptide concentration too low or detection wavelength mismatched; increase concentration or verify wavelength setting
Optimizing the gradient based on an initial broad scouting run, then narrowing the acetonitrile range around the main peak, improves separation of closely eluting impurities without unnecessarily extending runtime.
How to interpret a Certificate of Analysis and verify purity claims
A Certificate of Analysis is only as reliable as the data it presents. A COA that reports a purity percentage without supporting chromatographic data is unverifiable. The integration parameters, column specifications, and gradient program all influence the reported number, and without them, you cannot assess whether the result is credible.
| COA Element | What It Reveals |
|---|---|
| Raw chromatogram | Peak shape, baseline quality, and presence of unresolved impurities |
| Column type and pore size | Whether the method was appropriate for the peptide’s molecular weight |
| Mobile phase composition | Confirms TFA or formic acid use; relevant for MS compatibility |
| Gradient program | Determines resolution capability; slow gradients resolve more impurities |
| Detection wavelength | 214 nm or 220 nm confirms peptide bond detection, not side-chain-specific |
| MS data (ESI or MALDI) | Confirms correct molecular weight and rules out sequence errors |
| Peptide content (%) | Distinguishes chromatographic purity from true mass-based content |
The distinction between purity percentage and peptide content matters for dosing accuracy. A COA showing 98% HPLC purity alongside a peptide content of 80% by amino acid analysis tells you that 20% of the weighed mass is water, counter ions, or salts. Calculating dose from mass alone, without accounting for content, leads to systematic underdosing.
Third-party laboratory testing removes the conflict of interest inherent in supplier-generated data. An independent laboratory running the same sample under standardized conditions provides a check on both the analytical method and the reported result. When evaluating a supplier, choosing a supplier with independent COA data and lot-specific documentation is a direct indicator of analytical rigor.
Pro Tip: Always request the MS spectrum alongside the HPLC chromatogram. A purity figure without identity confirmation tells you the sample is mostly one thing — not that it is the right thing.
Optimized-aminos publishes a third-party-tested COA for every product, including raw HPLC chromatograms, MS identity confirmation, and full method details, verified to ≥98% purity by third-party testing. For researchers who need HPLC-verified research peptides with complete documentation, this level of traceability is the baseline for reproducible science.

Key Takeaways
HPLC purity testing, combined with MS identity confirmation and a complete COA, is the minimum standard for research-grade peptide quality assurance.
| Point | Details |
|---|---|
| HPLC is the primary method | Purity is calculated as main peak area percentage at 214 nm UV detection. |
| Purity thresholds vary by application | In vivo studies require ≥95% purity; enzymatic assays may accept —. |
| MS confirms identity, not just purity | ESI-MS compares observed mass to theoretical value to verify correct sequence. |
| COA must include raw chromatograms | Without method details and raw data, a purity percentage cannot be independently verified. |
| Chromatographic purity differs from peptide content | Absolute content is lower due to water, counter ions, and salts invisible to UV detection. |
Recommended
- How to Publish Original Peptide Sourcing Survey Findings | O
- Peptide Reconstitution & Storage Guide (Lab Handling) | Opti
- What Are Research Peptides? A Guide to Peptide Biochemistry
- How to Reconstitute Peptides: Step-by-Step Guide | Optimized
For laboratory and research use only. Not for human or animal consumption.