Research Blog
Mass Spectrometry Peptides: Methods and Workflows for Researchers
Published
Explore essential methods for mass spectrometry peptides analysis. Discover workflows, ionization techniques, and QC checkpoints today!
Mass Spectrometry Peptides: Methods and Workflows for Researchers
Mass spectrometry for peptide analysis is the gold standard in proteomics: you digest a protein mixture with trypsin, separate the resulting peptides by nanoLC, ionize them via ESI or MALDI, fragment them in the mass analyzer, and then identify sequences through database searching or de novo reconstruction. This guide covers every decision point in that workflow.
What you will find here:
- When to choose discovery shotgun (DDA), data-independent acquisition (DIA), or targeted SRM/PRM workflows
- Which ionization source, mass analyzer, and fragmentation method fits your peptide type and PTM of interest
- How to set search parameters, control false discovery rate, and apply ML-assisted tools like Prosit and Spectralis
- Where QC checkpoints belong and what a valid Certificate of Analysis should confirm
Discovery vs. targeted at a glance: Use shotgun proteomics with DDA when you need broad coverage of an unknown proteome. Switch to DIA for deep, reproducible quantification across many samples. Reserve SRM/PRM for validating specific analytes at high sensitivity.
Table of Contents
- How should you prepare samples for peptide MS analysis?
- How do nanoLC and MALDI sample introduction differ in practice?
- How do ESI and MALDI ionize peptides, and what settings matter?
- Which mass analyzer fits your experiment?
- How do fragmentation methods determine what you can identify?
- DDA, DIA, or targeted: which acquisition strategy should you use?
- How do database searching, FDR control, and ML tools work together?
- What are the most common pitfalls in peptide identification?
- A compact shotgun proteomics workflow with QC checkpoints
- How does QC verification and COA data fit into your MS workflow?
- Key Takeaways
- What the field gets wrong about de novo sequencing
- Optimized-aminos provides COA-verified peptides ready for MS workflows
- Curated resources for peptide MS analysis
How should you prepare samples for peptide MS analysis?
Sample preparation is where most experiments succeed or fail before the instrument is even switched on. Detergents like SDS and polymers such as polyethylene glycol cause severe ion suppression in ESI; they must be removed or substituted with MS-compatible alternatives (RapiGest SF, n-dodecyl-β-D-maltoside) before digestion.
How do nanoLC and MALDI sample introduction differ in practice?
Separation before the MS inlet reduces sample complexity, expands dynamic range, and prevents ion suppression from co-eluting matrix components. Without it, abundant peptides dominate the spectrum and low-abundance species are invisible.
NanoLC-ESI (recommended for most shotgun and targeted experiments):
- Column types: C18 reversed-phase, 75 µm inner diameter, 15–50 cm length, 1.7–3 µm particle size (sub-2 µm for ultra-high-pressure systems)
- Flow rates: 50–300 nL/min; lower flow rates improve ESI sensitivity by reducing droplet size and increasing ionization efficiency
- Typical gradient: 5–35% acetonitrile over 60–120 minutes for a standard cell lysate digest; extend to 180–240 minutes for deep proteome fractionation
- Mobile phase A: 0.1% formic acid in water; mobile phase B: 0.1% formic acid in acetonitrile
- Column temperature: 40–60°C to improve peak shape and reproducibility
- Sample loading: 200 ng–2 µg total peptide per injection for a standard experiment
The shotgun proteomics workflow reference confirms that nanoHPLC at approximately 50 nL/min is standard practice for maintaining the sensitivity needed to detect low-abundance peptides from complex digests.
MALDI sample preparation (preferred for simpler mixtures and high-throughput screening):
- Mix peptide solution 1:1 with matrix (α-cyano-4-hydroxycinnamic acid, CHCA, for tryptic peptides; sinapinic acid for intact proteins)
- Spot 0.5–1 µL onto a stainless-steel target plate; allow to air-dry or use the dried-droplet method
- MALDI-TOF peptide mass fingerprinting (PMF) is fast and cost-effective for identifying purified proteins or confirming synthetic peptide identity
- MALDI-MS/MS on a MALDI-TOF/TOF platform extends to sequence confirmation, though coverage per peptide is lower than nanoLC-ESI-MS/MS
Practical tradeoffs:
- NanoLC-ESI handles complex mixtures, supports online fractionation, and couples directly to high-resolution analyzers (Orbitrap, Q-TOF)
- MALDI is tolerant of moderate salt concentrations, requires no online separation for simple samples, and delivers rapid throughput for plate-based screening
- MALDI is less suited to quantification and to samples where peptide co-elution would be problematic without prior separation
How do ESI and MALDI ionize peptides, and what settings matter?
Both techniques convert peptides in solution or on a surface into gas-phase ions without breaking covalent bonds, a property described as “soft ionization.” The choice between them shapes everything downstream: charge-state distribution, analyzer compatibility, and fragmentation behavior.
ESI sprays a peptide solution through a metal emitter held at 2–4 kV relative to the MS inlet. Solvent evaporation concentrates charge on the droplet surface until Coulombic repulsion ejects multiply charged peptide ions. A typical tryptic peptide of 1–3 kDa appears as [M+2H]²⁺ or [M+3H]³⁺ ions, which is ideal for CID/HCD fragmentation and high-resolution detection.
MALDI co-crystallizes the analyte with a UV-absorbing matrix. A pulsed laser desorbs and ionizes the mixture, producing predominantly singly charged [M+H]⁺ ions. This simplifies spectra but limits fragmentation efficiency for sequence-level work.
Practical ESI settings and tips:
- Emitter voltage: 1.8–2.2 kV for nanoflow emitters (pulled fused silica, 5–10 µm tip); 3–4 kV for microflow or standard-bore emitters
- Spray stability improves with a stable solvent gradient; avoid sudden organic steps that collapse the Taylor cone
- Capillary temperature: 250–320°C to desolvate ions without thermal degradation
- Sheath gas (nitrogen): set to the minimum needed for stable spray; excess gas dilutes ion current
MALDI matrix selection:
- CHCA: standard for tryptic peptides under 3 kDa
- DHB (2,5-dihydroxybenzoic acid): better for glycopeptides and larger fragments
- Sinapinic acid: intact proteins above 10 kDa
Pro Tip: In ESI, the single most effective way to reduce ion suppression from a complex digest is to reduce injection concentration rather than increase it. Overloading the column causes peptide co-elution, which compresses the dynamic range and suppresses low-abundance ions. Start with 200 ng and scale up only if signal is insufficient, not the reverse.
Which mass analyzer fits your experiment?
The analyzer determines resolution, mass accuracy, scan speed, and ultimately whether you can distinguish two peptides differing by a single deamidation or phosphorylation. High-resolution instruments resolve isotopic peaks; the monoisotopic mass (the peak containing only ¹²C, ¹H, ¹⁴N, ¹⁶O, ³²S) is preferred for database searching when isotopes are resolved. As noted in the Carr and Annan fundamentals reference, ¹³C contributes 1.1% and ¹⁵N 0.36% to the isotopic envelope of a typical peptide, so the M+1 isotope peak becomes dominant for peptides above roughly 1,500 Da.
| Analyzer class | Key strength | Best use-case | Typical mass accuracy |
|---|---|---|---|
| Orbitrap (e.g., Q-Exactive, Exploris) | Ultra-high resolution, accurate mass | Discovery proteomics, PTM localization, DIA | < 5 ppm; < 2 ppm with internal calibration |
| Q-TOF | Fast MS/MS, good sensitivity | DIA, metabolomics, intact mass | 2–5 ppm |
| Ion trap (linear or 3D) | High sensitivity, MSⁿ capability | Low-abundance targets, structural elucidation | 100–300 ppm |
| Quadrupole (standalone or in triple-quad) | Precise ion selection, SRM/MRM | Targeted quantification, clinical assays | Unit resolution |
| Hybrid (Q-Orbitrap, Q-TOF) | Combined selection + high-res detection | DDA, DIA, PRM | < 5 ppm MS/MS |
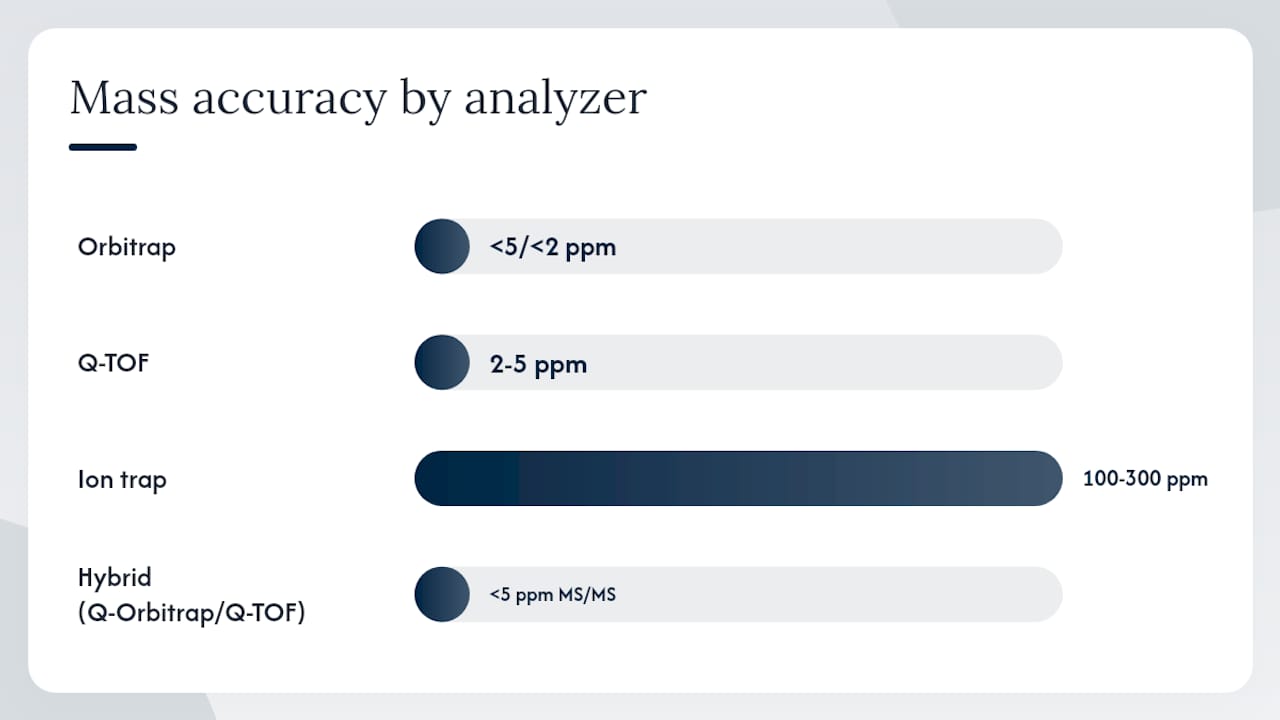
Internal calibration with lock masses (e.g., the polysiloxane ion at m/z 445.120025 in Thermo instruments) routinely pushes mass errors below 1.5 ppm, which is necessary to discriminate near-isobaric residues such as glutamine (Gln, 128.058 Da) and lysine (Lys, 128.095 Da) at the MS/MS level.
For calibration, run a system suitability standard (e.g., a BSA digest or a defined peptide mix) at the start of each sequence. Accept the run only if mass accuracy on known peptides is within your pre-set tolerance, typically ±5 ppm for survey scans and ±10 ppm for MS/MS on a well-maintained Orbitrap.
How do fragmentation methods determine what you can identify?
Fragmentation is where sequence information is generated. The method you choose determines which ion series dominate the spectrum, whether labile PTMs survive, and how confidently you can localize a modification to a specific residue.
CID and HCD apply kinetic energy to the precursor ion, causing backbone amide bonds to break. The result is predominantly b-ions (N-terminal fragments retaining the charge) and y-ions (C-terminal fragments). HCD, the beam-type variant used in Orbitrap instruments, produces cleaner spectra with better high-mass ion coverage than resonance CID. Both methods are fast and work well for tryptic peptides under roughly 20 residues.
ETD and ECD transfer electrons to multiply charged precursor ions, cleaving N-Cα bonds to generate c-ions and z-ions. Because the fragmentation mechanism does not involve vibrational excitation, labile PTMs such as phosphorylation, O-GlcNAc, and sulfotyrosine survive intact on the fragment ions. ETD is particularly effective for phosphopeptides and for long, highly charged peptides where CID produces poor sequence coverage. As described in the tandem MS reference, ETD’s independence from peptide length and PTM lability makes it a key method for these cases, and it can be performed on many current benchtop instruments.
UVPD (ultraviolet photodissociation) uses 193 nm photons to generate a rich mixture of a, b, c, x, y, and z ions, providing the highest sequence coverage of any fragmentation method. It is particularly useful for top-down proteomics and for peptides that resist CID and ETD.
Fragment ion nomenclature follows the Roepstorff-Fohlman system: b-ions carry the N-terminus; y-ions carry the C-terminus. For a peptide ACDEFG, the b₂ ion covers AC (mass = sum of A + C residue masses + 1 Da for the N-terminal H), and y₄ ion covers DEFG (sum of D + E + F + G + 18 Da for the C-terminal OH + H). Adjacent b-ions differ by one residue mass, which is how sequence is read directly from the spectrum.
| Fragmentation method | Best for | Limitations |
|---|---|---|
| CID / HCD | Standard tryptic peptides, fast acquisition | Poor on labile PTMs; loses phospho group as neutral loss |
| ETD / ECD | Phosphopeptides, long peptides, high charge states | Requires z ≥ 3; slower; less effective on short peptides |
| UVPD | Top-down, complex PTMs, maximum coverage | Specialized hardware; complex spectra require careful deconvolution |
| Supplemental activation (EThcD) | Phospho + sequence coverage combined | Instrument-dependent; increases scan time |
When CID fails on a peptide longer than 20 residues or when phospho-site localization is ambiguous, switch to ETD or EThcD (ETD with supplemental HCD activation) before concluding the site cannot be assigned.
DDA, DIA, or targeted: which acquisition strategy should you use?
DDA (data-dependent acquisition) selects the most abundant precursor ions in each survey scan for fragmentation. It is the default for discovery proteomics but introduces stochastic sampling: low-abundance peptides may not be selected across replicates.
DIA (data-independent acquisition) fragments all precursors within defined m/z windows simultaneously, producing highly complex MS/MS spectra that are deconvoluted computationally. DIA delivers reproducible peptide detection across samples and is now the preferred mode for large quantitative cohorts.
SRM (selected reaction monitoring) and PRM (parallel reaction monitoring) pre-select specific precursor-to-fragment ion transitions, providing the highest sensitivity and quantitative precision for a defined target list. SRM runs on triple-quadrupole instruments; PRM uses a high-resolution analyzer (Orbitrap or Q-TOF) to monitor all fragments of a selected precursor simultaneously.
Choosing your mode:
- Discovery proteomics, unknown proteome: DDA with fractionation
- Reproducible quantification across 20+ samples: DIA
- Validation of 10–100 specific proteins: PRM
- Clinical or regulatory assays requiring maximum sensitivity: SRM on a triple-quadrupole
Acquisition design checklist:
- Injection amount: 200 ng–1 µg for DDA; 200 ng–500 ng for DIA; as low as 1–10 ng for SRM
- Gradient length: 60 min minimum for DDA; 90–120 min for deep DIA; 15–30 min for targeted SRM
- Dynamic exclusion (DDA): 20–30 seconds to prevent re-sampling dominant peptides
- DIA window width: 12–25 m/z for standard proteomes; narrower windows improve selectivity for complex samples
- MS1 resolution: 60,000–120,000 FWHM for Orbitrap-based DDA and DIA; MS2 at 15,000–30,000 FWHM
How do database searching, FDR control, and ML tools work together?
Database searching remains the standard first step: experimental MS/MS spectra are matched against theoretical spectra generated from an in-silico digest of a reference proteome. The result is a peptide-spectrum match (PSM) scored by the search engine.
Major search engines and their strengths:
FDR control and decoy strategy:
Every database search should include a decoy database (reversed or shuffled protein sequences). PSMs against decoy entries estimate the false positive rate. The target-decoy approach sets a PSM-level q-value threshold (typically 0.01, i.e., 1% FDR) at the PSM, peptide, and protein levels. Report all three levels in publications; a 1% protein-level FDR does not guarantee 1% PSM-level FDR.
ML-assisted tools:
- Spectralis applies machine learning to de novo sequencing. A Nature Communications study reports that Spectralis substantially improved recall at high precision compared to prior state-of-the-art de novo methods, with nearly two-fold improvement at 90% precision in their benchmark.
De novo tools are not replacements for database searching on well-characterized proteomes. They are most valuable for spectra that database search cannot assign, for novel PTM discovery, and for organisms lacking a complete reference proteome.
Pro Tip: Set your search with a maximum of two missed cleavages, carbamidomethylation of Cys as a fixed modification, and methionine oxidation as a variable modification. Keep variable modifications to three or fewer per search; each additional variable modification multiplies the search space and inflates false positives. Precursor tolerance of 5–10 ppm and fragment tolerance of 0.02 Da (Orbitrap) or 0.5 Da (ion trap) are standard starting points.
The Hunt Lab guide to de novo peptide sequence analysis remains one of the most practical references for learning to validate search results manually and interpret spectra when automated tools disagree.
What are the most common pitfalls in peptide identification?
Even well-designed experiments produce misidentifications. Recognizing the patterns early saves time during data review.
Frequent pitfalls:
- Incorrect monoisotopic peak selection. For peptides above roughly 1,500 Da, the M+1 or M+2 isotope peak may be more abundant than the monoisotopic peak. Selecting the wrong isotope shifts the precursor mass by 1.003 Da and causes a search miss or incorrect identification.
- Mis-assigned charge states. Automated charge-state assignment fails on low signal-to-noise precursors. A doubly charged ion misidentified as singly charged doubles the apparent mass; always verify charge state from the isotope spacing (Δm/z = 1/z).
- PTM localization errors. A phosphorylation on a peptide with two Ser residues may be assigned to either site with equal probability if the fragment ions covering the two sites are absent or low-intensity. Use phosphoRS, PTMiner, or similar localization scoring tools and report only sites with localization probability above 0.75.
- Co-isolation interference in DDA and isobaric labeling. When two precursors fall within the isolation window, their fragment ions mix. In TMT experiments, this compresses quantitative ratios toward 1:1. Narrow isolation windows (1–2 m/z) and SPS-MS3 reduce this artifact.
- Contaminant signatures. Keratin peptides (from skin and hair) and trypsin autolysis peptides (VATVSLPR, LSEPAELTDAVK) are the most common contaminants. Maintain a contaminant FASTA file in your search database and filter these entries from quantitative analyses.
Validation checklist:
- Confirm identification in at least two independent replicates
- Check fragment ion coverage: a minimum of four consecutive b- or y-ions spanning the full sequence is a reasonable threshold
- Verify retention time consistency: the same peptide should elute within ±1 minute across runs on the same column
- For synthetic or reference peptides, compare against a co-injected authentic standard to confirm both mass and retention time match
A compact shotgun proteomics workflow with QC checkpoints
The standard bottom-up shotgun workflow runs from cell lysis to protein list in roughly two to three days for a typical cell lysate experiment.
| Step | Typical parameters | Timing | QC checkpoint |
|---|---|---|---|
| Protein extraction | RIPA or urea lysis; BCA quantification | 1–2 h | Yield ≥ 1 mg/mL; — |
| Reduction / alkylation | 10 mM DTT, 56°C, 30 min; 20 mM IAA, RT, 30 min dark | 1 h | Absence of free thiol by Ellman’s assay |
| Trypsin digestion | 1:25–1:50 enzyme:substrate; 37°C, 16 h | 16 h | Peptide yield ≥ 60% of input protein mass |
| Desalting (C18 SPE) | Equilibrate 0.1% FA; elute 60% ACN / 0.1% FA | 30 min | A280 of eluate; no visible pellet |
| NanoLC-MS/MS injection | 200 ng; 75 µm × 25 cm C18; 300 nL/min; 5–35% ACN, 90 min | 90–120 min | ≥ 1,000 PSMs from system suitability standard |
| MS acquisition (DDA) | MS1: 60,000 FWHM; MS2: 15,000 FWHM; top 15 precursors; dynamic exclusion 20 s | Per run | Mass accuracy ≤ 5 ppm on lock mass |
| Database search | MSFragger or MaxQuant; 1% FDR PSM/peptide/protein | 1–4 h | ≥ 500 protein groups at 1% FDR for 200 ng cell lysate |
| QC review | Check mass accuracy drift, peak width, ID rate | 30 min | Reject runs with > 10 ppm drift or < 50% of expected IDs |
For plasma proteomics, expect lower peptide yields and higher dynamic range challenges. Deplete the 14 most abundant plasma proteins (albumin, IgG, transferrin, etc.) before digestion, and extend the gradient to 120–180 minutes to improve coverage of low-abundance analytes.
Run-to-run consistency checklist:
- Inject a system suitability peptide mix (e.g., iRT peptides from Biognosys) at the start of each sequence
- Monitor peak width at half-maximum: accept runs within ±20% of the reference value
- Track mass accuracy on the lock mass ion across the run; flag any drift above 5 ppm
- Compare total peptide IDs and protein groups to a historical baseline; a drop of more than 20% warrants column inspection or source cleaning
How does QC verification and COA data fit into your MS workflow?
A peptide Certificate of Analysis (COA) is not just a shipping document. For researchers using synthetic peptides as internal standards, calibrants, or reference compounds, the COA is the first line of quality evidence before the peptide enters the instrument.
What a valid peptide COA should include:
- Purity by HPLC (reversed-phase C18), reported as area percentage; 99%+ purity is the standard for quantitative MS reference standards
- Observed molecular weight by MS (ESI or MALDI), confirming the correct sequence and absence of major truncations or adducts
- Batch number and synthesis date for traceability
- Storage conditions and recommended reconstitution solvent
- Amino acid sequence in single-letter code
Understanding how to read the HPLC trace on a COA is a practical skill: a single sharp peak at the expected retention time with no shoulders or secondary peaks confirms purity. The guide on reading an HPLC chromatogram on a peptide COA at Optimized-aminos walks through exactly what each feature of the trace means and when to flag a batch for retesting.
Recommended QC injection workflow:
- Run a blank (mobile phase only) before the first sample to confirm no carryover
- Inject a positive-control peptide of known mass and retention time as the first sample
- Accept the sequence only if the control peptide elutes within ±1 minute of the reference and mass accuracy is within ±5 ppm
- For synthetic peptide standards, confirm identity by comparing MS results to HPLC purity data; HPLC confirms purity, MS confirms sequence identity. Neither alone is sufficient.
Optimized-aminos publishes a third-party-tested COA for every product, with purity confirmed by HPLC and molecular weight verified by MS. Each batch carries a unique lot number, enabling full traceability from synthesis to your instrument. For labs procuring multiple compounds, the bundled research sets simplify documentation by consolidating COA records across related peptides.
Pro Tip: When a vendor’s COA shows 99%+ HPLC purity but the MS spectrum shows an unexpected +16 Da adduct on the dominant peak, the peptide has oxidized methionine. The HPLC purity is real, but the sequence identity is compromised for any experiment where Met oxidation state matters. Always cross-check HPLC purity with the MS molecular weight before use, not after.
Key Takeaways
Peptide mass spectrometry workflows require matched choices at every stage: ionization source, mass analyzer, fragmentation method, acquisition mode, and data analysis strategy must all align with the biological question and sample type.
| Point | Details |
|---|---|
| Match fragmentation to PTM type | Use ETD/ECD for labile PTMs (phospho, O-GlcNAc); use CID/HCD for standard tryptic peptides. |
| Control FDR at all three levels | Report PSM-, peptide-, and protein-level q-values at 1% FDR; decoy database searching is non-negotiable. |
| Apply ML tools for unassigned spectra | Prosit improves PSM rescoring; Spectralis and DeepNovo recover identifications that database search misses. |
| Verify COA before injection | A valid COA must include HPLC purity (≥99%), MS-confirmed molecular weight, and a batch number for traceability. |
| Optimized-aminos for reference peptides | Each batch ships with a COA confirming 99%+ HPLC purity and MS-verified molecular weight, with full lot traceability. |
What the field gets wrong about de novo sequencing
The conventional view treats de novo sequencing as a fallback: something you do when database search fails, using older tools that require expert manual interpretation. That framing is outdated and, in practice, costs researchers identifications they could have made.
The Spectralis study in Nature Communications demonstrated that modern ML-assisted de novo methods now achieve nearly two-fold improvement in recall at 90% precision compared to prior state-of-the-art approaches. That is not a marginal gain. For any experiment involving a non-model organism, a heavily mutated cancer proteome, or a synthetic peptide library, running de novo analysis in parallel with database searching is no longer optional if you want complete coverage.
The second underappreciated point is manual spectrum interpretation. Automated tools fail silently. A PSM that passes a 1% FDR threshold can still be wrong for a specific spectrum, particularly when the peptide is short, the charge state is ambiguous, or a PTM shifts the expected ion series. The Hunt Lab guide makes the case that manual de novo skills are not obsolete: they are the only way to catch errors that automated rescoring misses. Every researcher who works with MS data regularly should be able to read a fragment spectrum by hand, at least for the peptides that matter most to their conclusions.
The practical recommendation: run your primary database search with MSFragger or MaxQuant, rescore with Prosit-based tools, and then pass unassigned spectra through Spectralis or DeepNovo. The additional compute time is modest; the additional identifications can be substantial.
Optimized-aminos provides COA-verified peptides ready for MS workflows
Researchers who invest in a rigorous MS workflow deserve starting materials that match that standard. Optimized-aminos supplies lab-tested research peptides with 99%+ HPLC-verified purity and MS-confirmed molecular weight on every batch; backed by a published third-party COA covering purity, storage conditions, and sequence confirmation.
Every compound is third-party tested before it ships, so you are not relying on a vendor’s internal QC alone. For labs running multiple compounds in parallel, the pre-built research peptide bundles consolidate procurement and documentation into a single order, with all COAs included. Orders ship within 1–2 business days.
Browse the full catalog and download COA documentation at optimized-aminos.com/shop.
Curated resources for peptide MS analysis
| Resource | Purpose | Link |
|---|---|---|
| NIST Peptide Mass Spectral Libraries | Authoritative spectral reference library for matching experimental spectra and biomarker discovery | nist.gov |
| PRIDE / ProteomeXchange | Public repository for depositing and accessing raw MS data and search results | proteomexchange.org |
| Prosit | Deep learning MS/MS spectrum predictor for PSM rescoring and library generation | proteomicsdb.org/prosit |
| Spectralis | ML-assisted de novo sequencing with high recall at high precision | nature.com/articles/s41467-023-44323-7 |
| Hunt Lab de novo guide | Manual and computational de novo sequencing tutorial with fragment calculators | pmc.ncbi.nlm.nih.gov/articles/PMC11665681 |
| EPFL mstoolbox (Apm2s) | Browser-based tools for theoretical fragment calculation, isotopic matching, and peak picking | ms.epfl.ch |
| MaxQuant / Andromeda | Integrated Orbitrap data analysis, LFQ, and SILAC quantification | maxquant.org |
| MSFragger | Ultra-fast open search engine for large datasets and unexpected modifications | msfragger.nesvilab.org |
Which resource to consult first by task:
- A beginner’s guide to mass spectrometry–based proteomics
- Tandem Mass Spectrometry for Peptide and Protein Sequence Analysis
- Fundamentals of Biological Mass Spectrometry and Proteomics (Carr & Annan)
- The Hunt Lab Guide to De Novo Peptide Sequence Analysis by Tandem Mass Spectrometry
- Peptide Mass Spectral Libraries | NIST
- Automatic analysis of peptide and proteins mass spectrometry datasets - The ISIC- EPFL mstoolbox
- Spectralis: de novo peptide sequencing method leveraging ML (Nature Communications)
The Optimized-aminos research resources page also maintains a curated reference collection covering peptide QC, reconstitution protocols, and COA interpretation for researchers working with synthetic peptide standards.
This article is provided for general informational and educational purposes. It does not constitute professional laboratory, medical, or regulatory advice. Researchers should consult primary literature, instrument manufacturer documentation, and institutional guidelines for protocols specific to their experimental systems.
Recommended
- Top Peptide Sciences and True Peptides Alternatives for Rese
- What Are Research Peptides? A Guide to Peptide Biochemistry
- How to Publish Original Peptide Sourcing Survey Findings | O
- Top 6 Peptide Sciences Alternatives for Researchers | Optimi
For laboratory and research use only. Not for human or animal consumption.